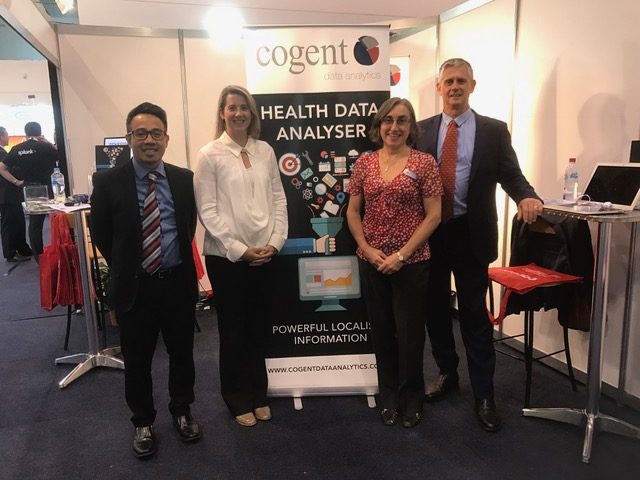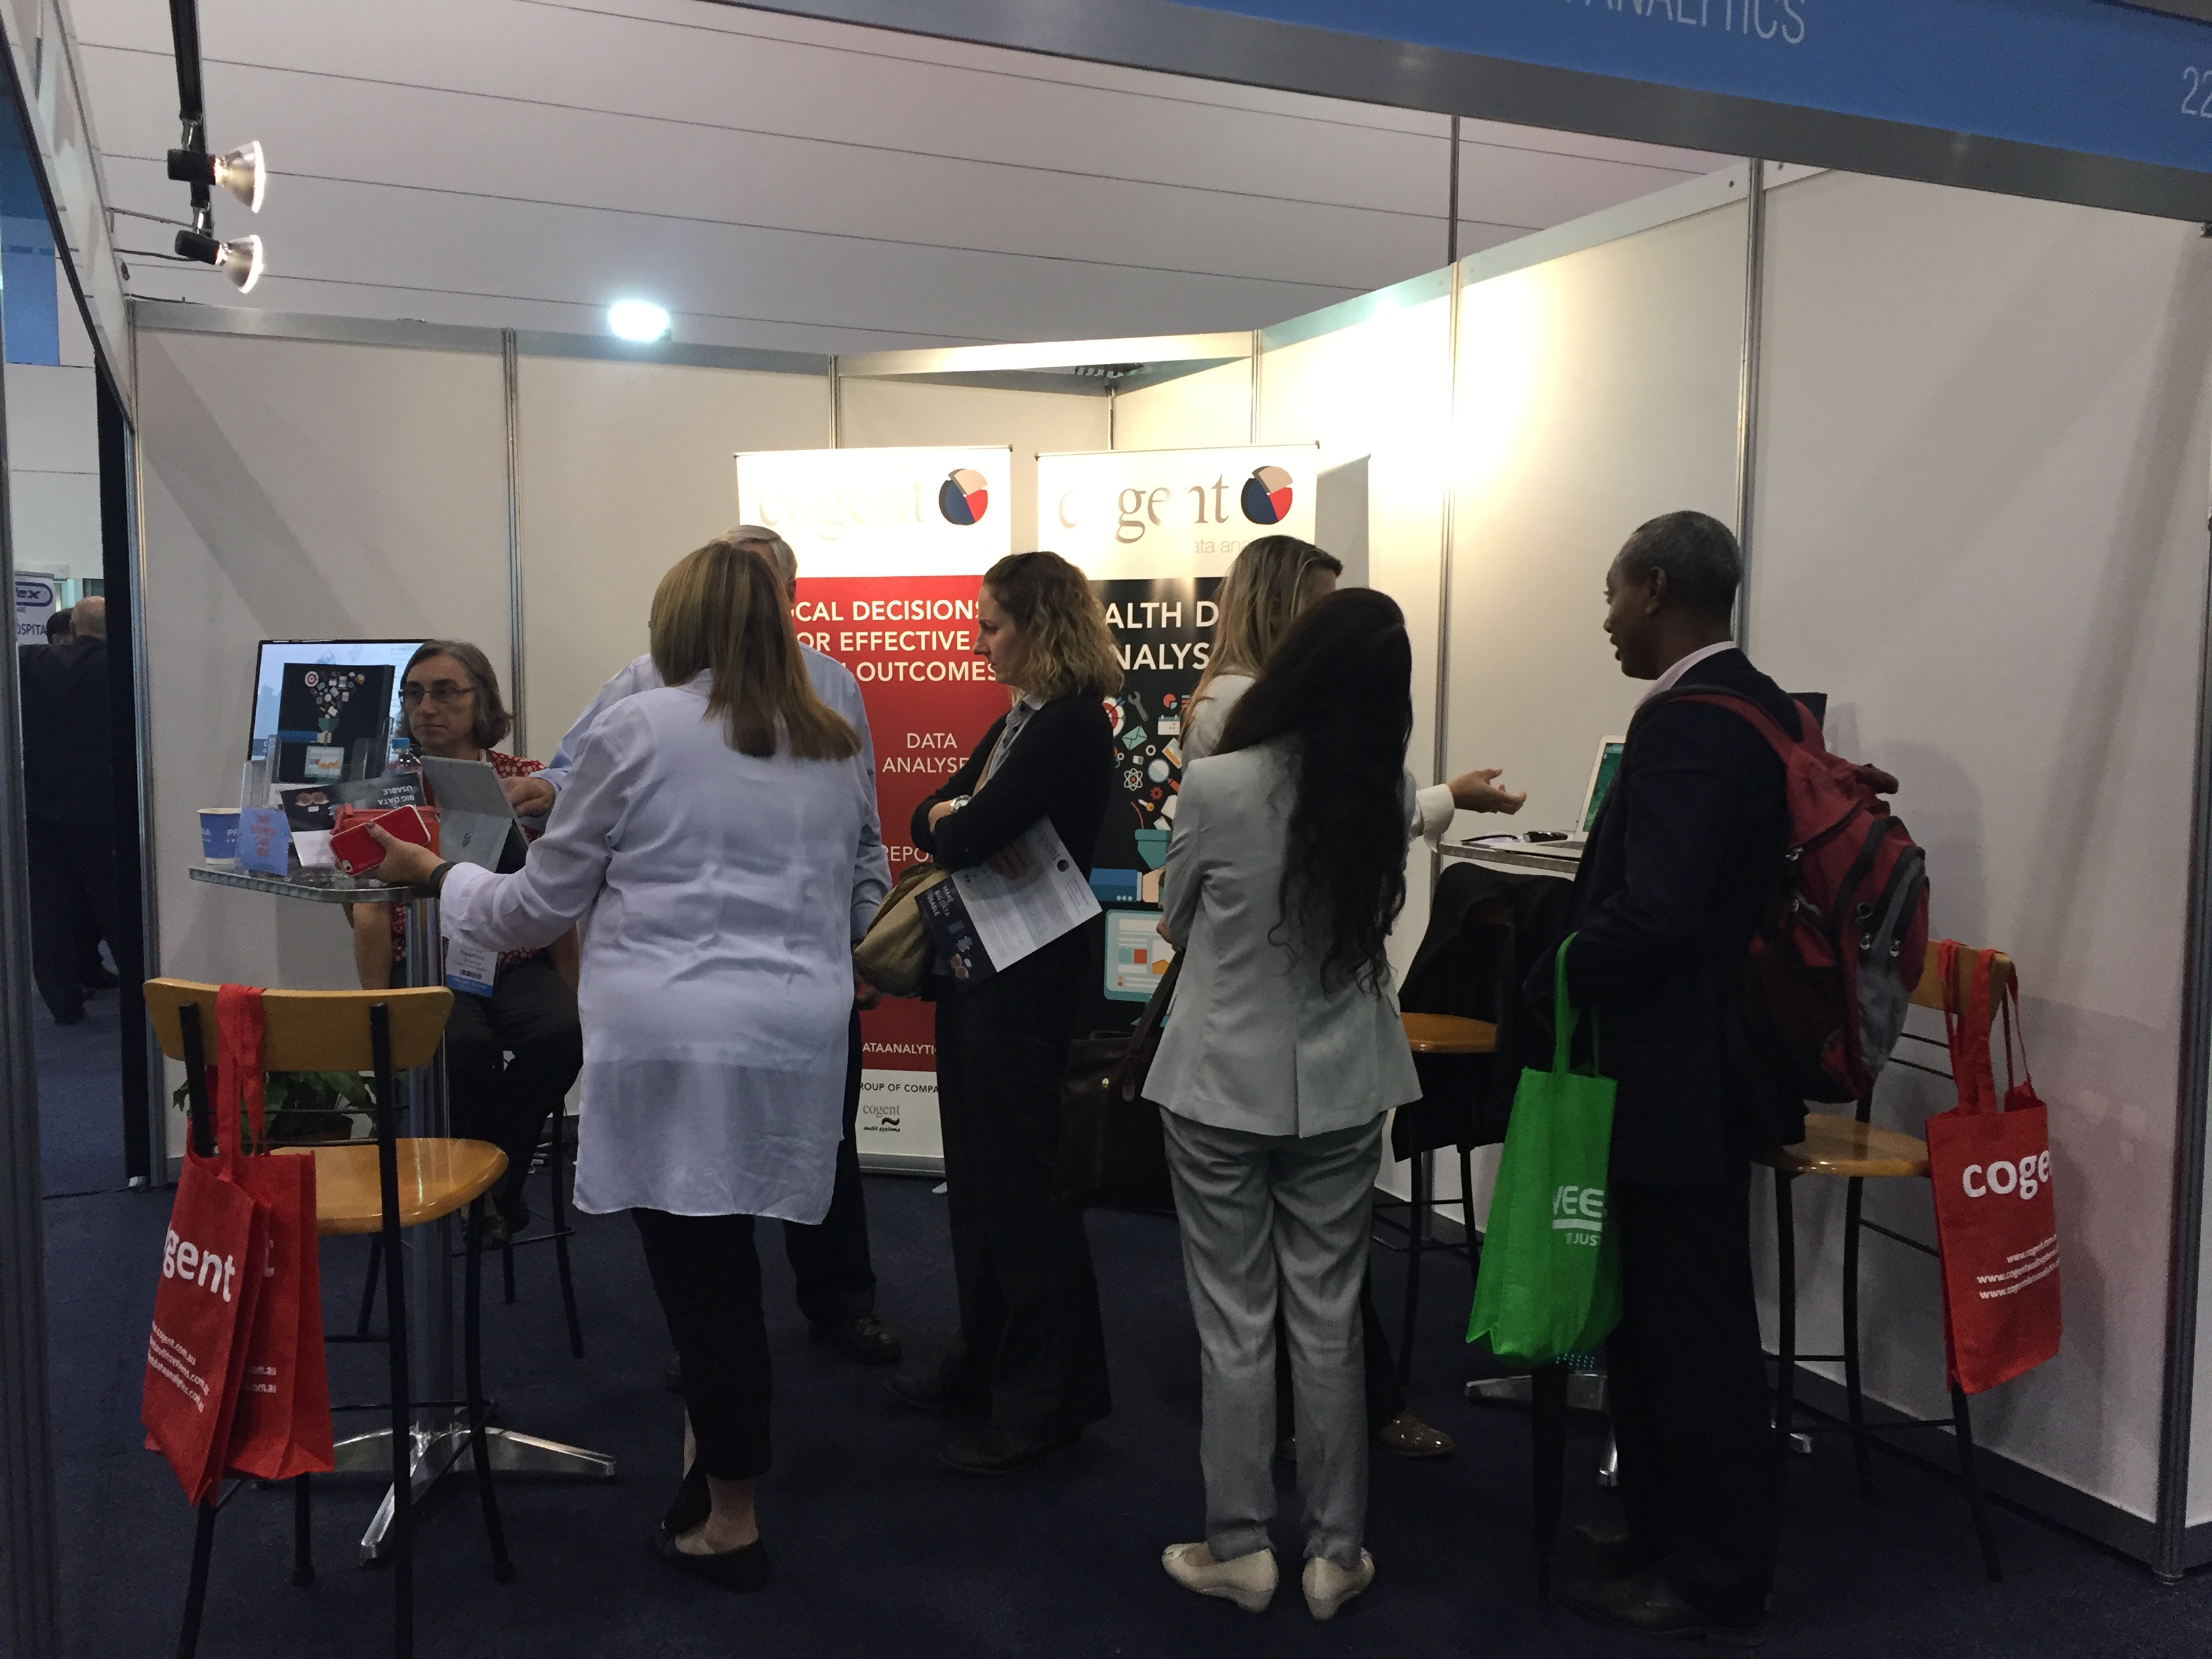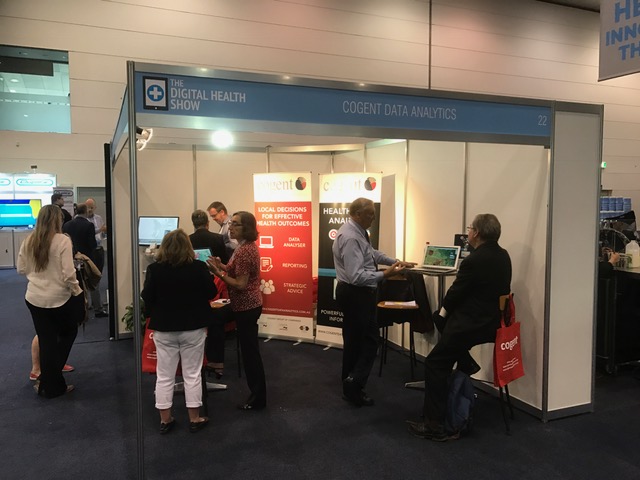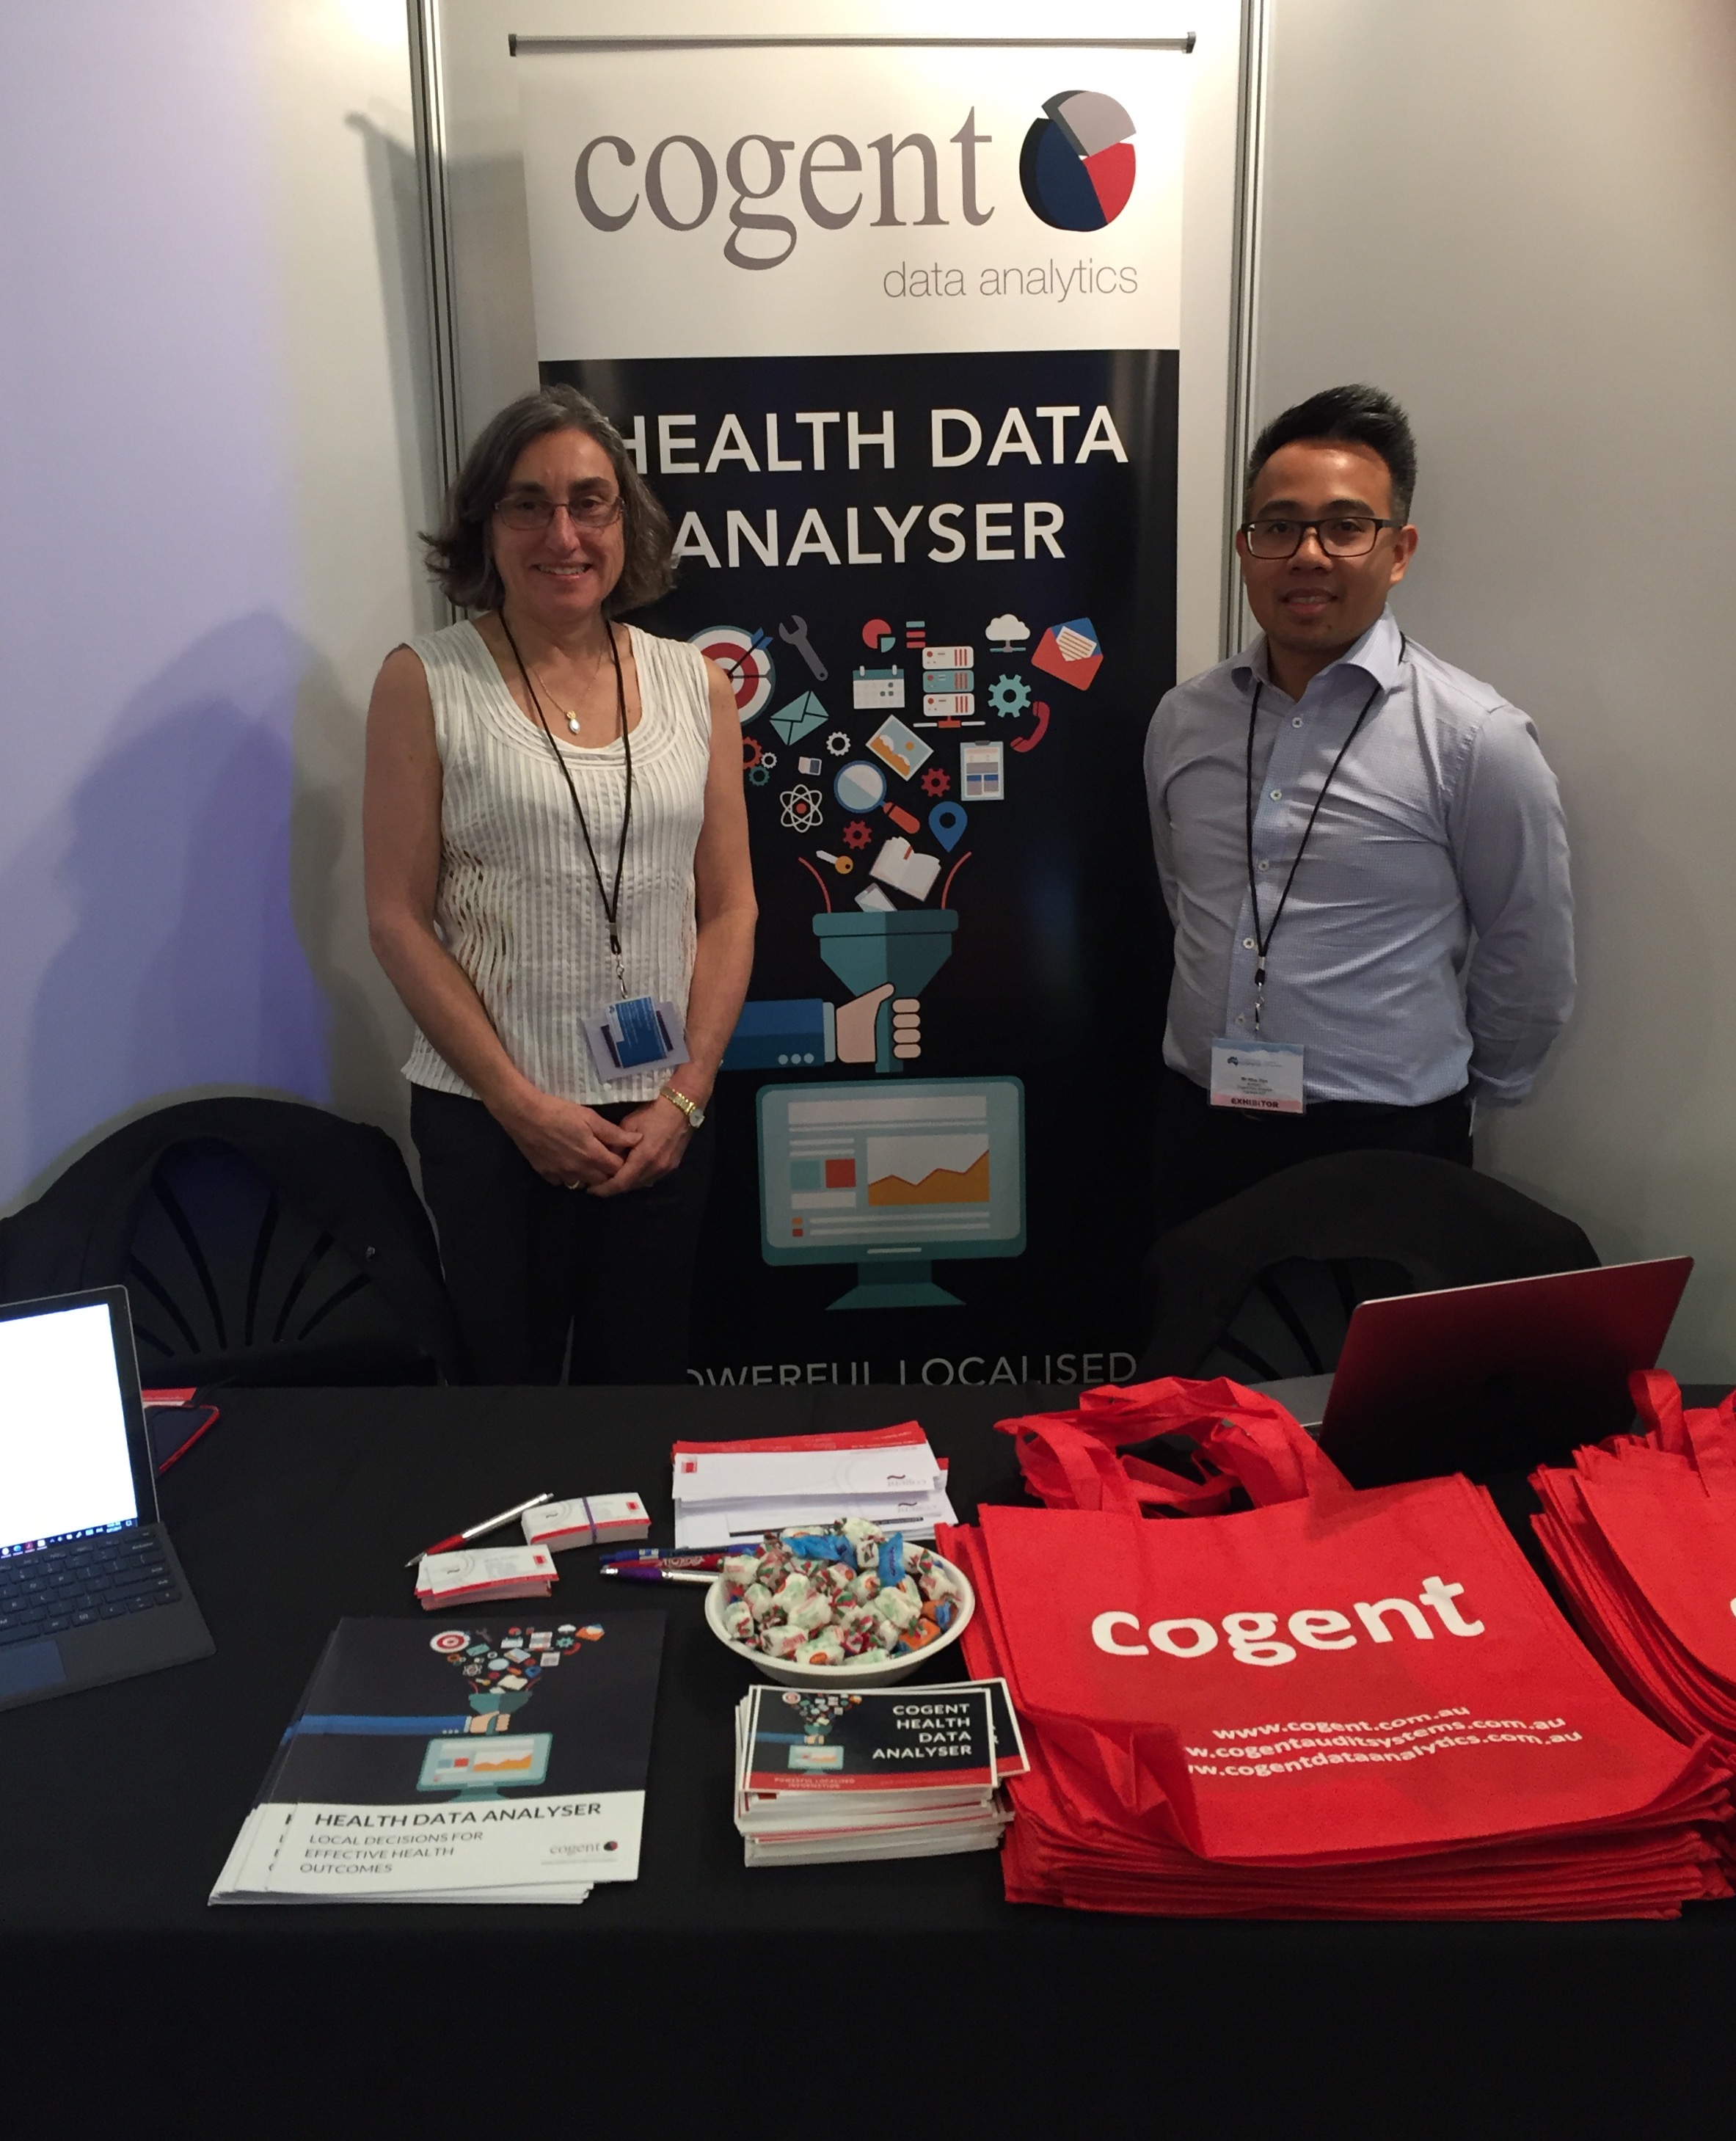
Mandy and Khai attended the myPHN Conference in Cairns, Far North Queensland on 8th and 9th July to showcase the Health Data Analyser to a largely Primary Health Network and health professional audience.
The Health Data Analyser received positive feedback and we had lots of interest from conference attendees and other exhibitors. It appeared that we were one of the only exhibitors showcasing a data analytics product.
What we learned
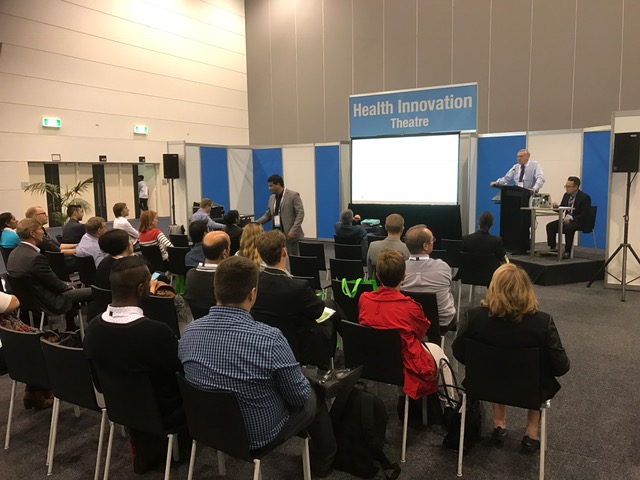
The myPHN conference was filled with committed and passionate professionals from the medical and allied health fields.
Michael Moore (CEO, Public Health Association of Australia) challenged the audience to look at health from three points:
- Protection – of the community from external threats eg avian flu
- Prevention – through evidence based strategies
- Promotion – to increase awareness
Digital health is emerging as both a tool through systems such as myhealth record, and a challenge to merge the various information streams into a coherent patient-centred message
It was also alarming to hear that more needs to be done to close the gap on Aboriginal and Torres Strait Islander life expectancy. The Hon Ken Wyatt AM, Minister for Aged Care and Minister for Indigenous Health addressed the conference as the keynote and is both very knowledgeable and passionate about his portfolios.
Some other highlights from the conference include the inspiring story from Christine Anu about her humble beginnings in the Torres Strait to becoming a one of Australia’s most iconic female Indigenous entertainer.
We were also very fortunate to witness such an uplifting and spiritual welcome from
Gerib Sik, an traditional dance group and the video can be seen on our facebook page: https://www.facebook.com/CogentBusinessSolutions
Lastly, we’d like to thank Health Reimagined for inviting us to exhibit at the 2017 myPHN Conference and provided significant support to get Cogent Data Analytics up to Cairns.
Here are some of the photos from the conference:
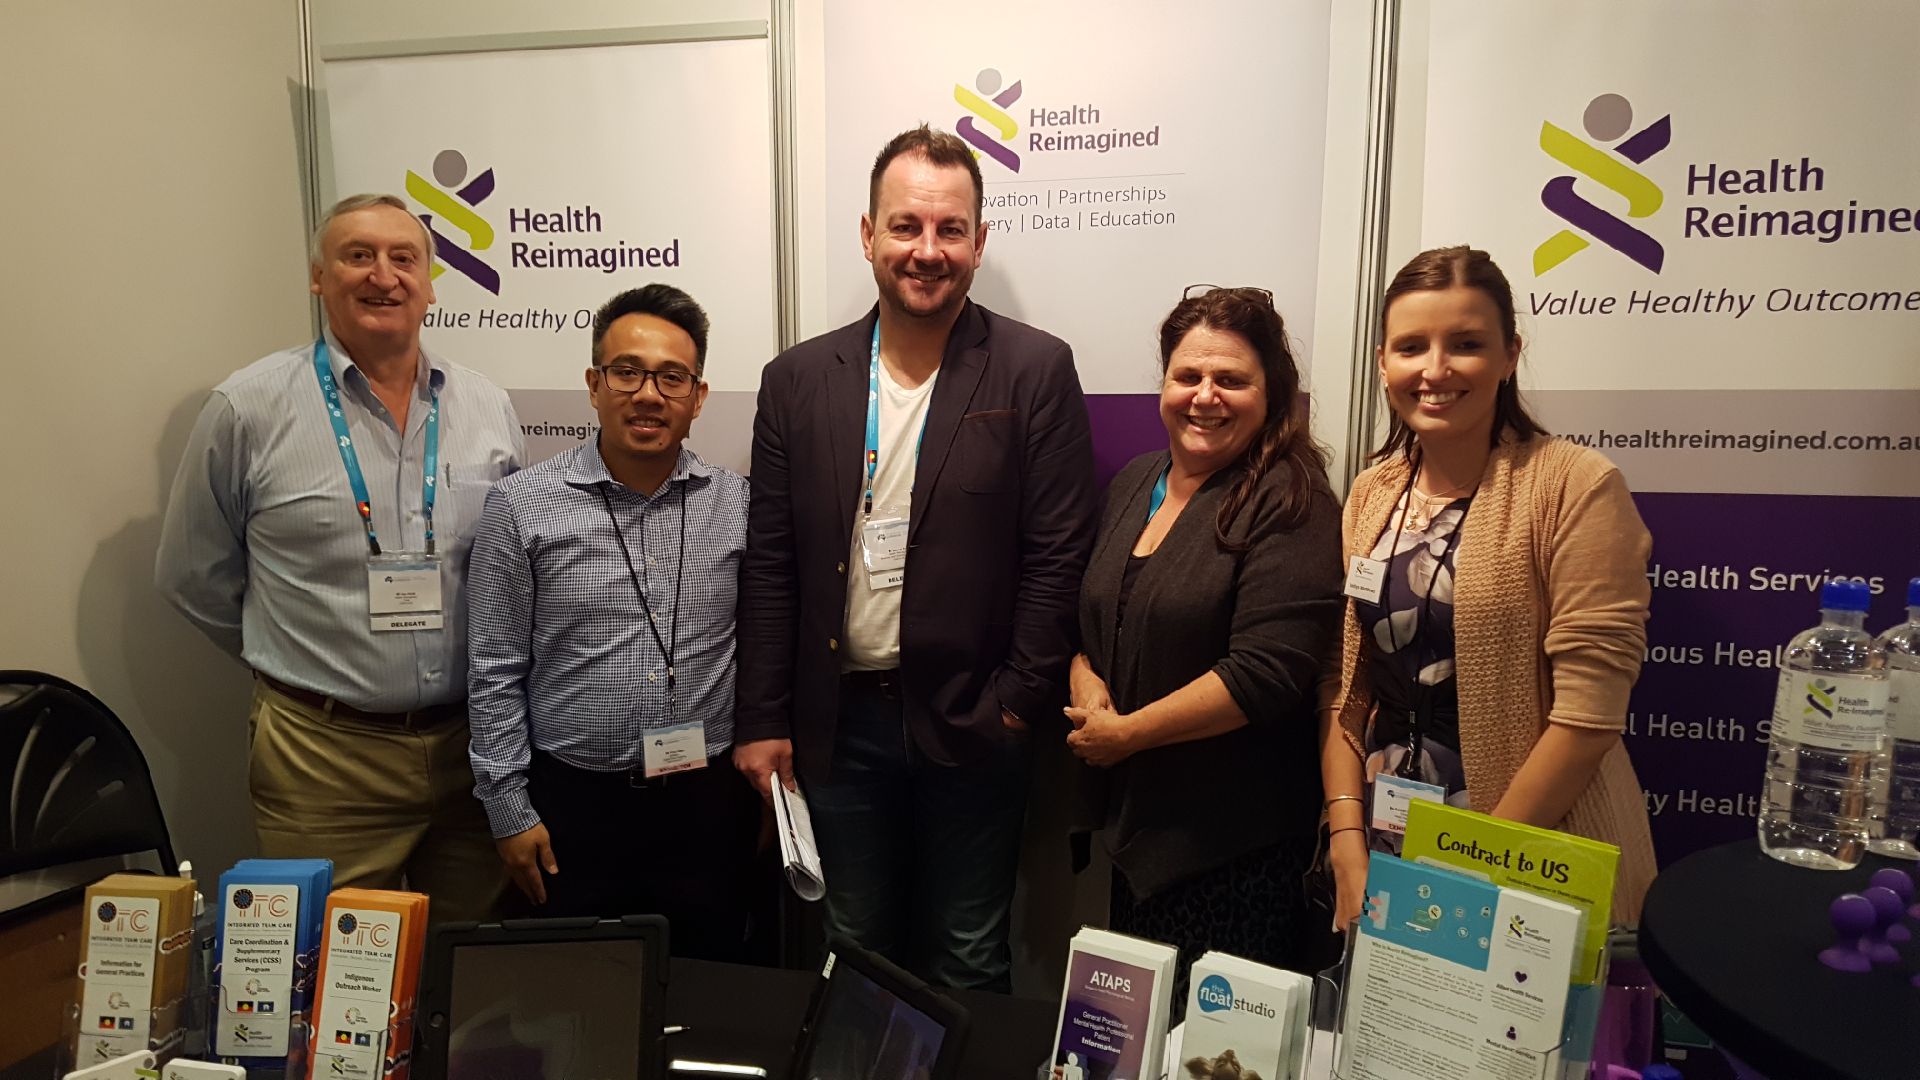
Khai with team from Health Reimagined
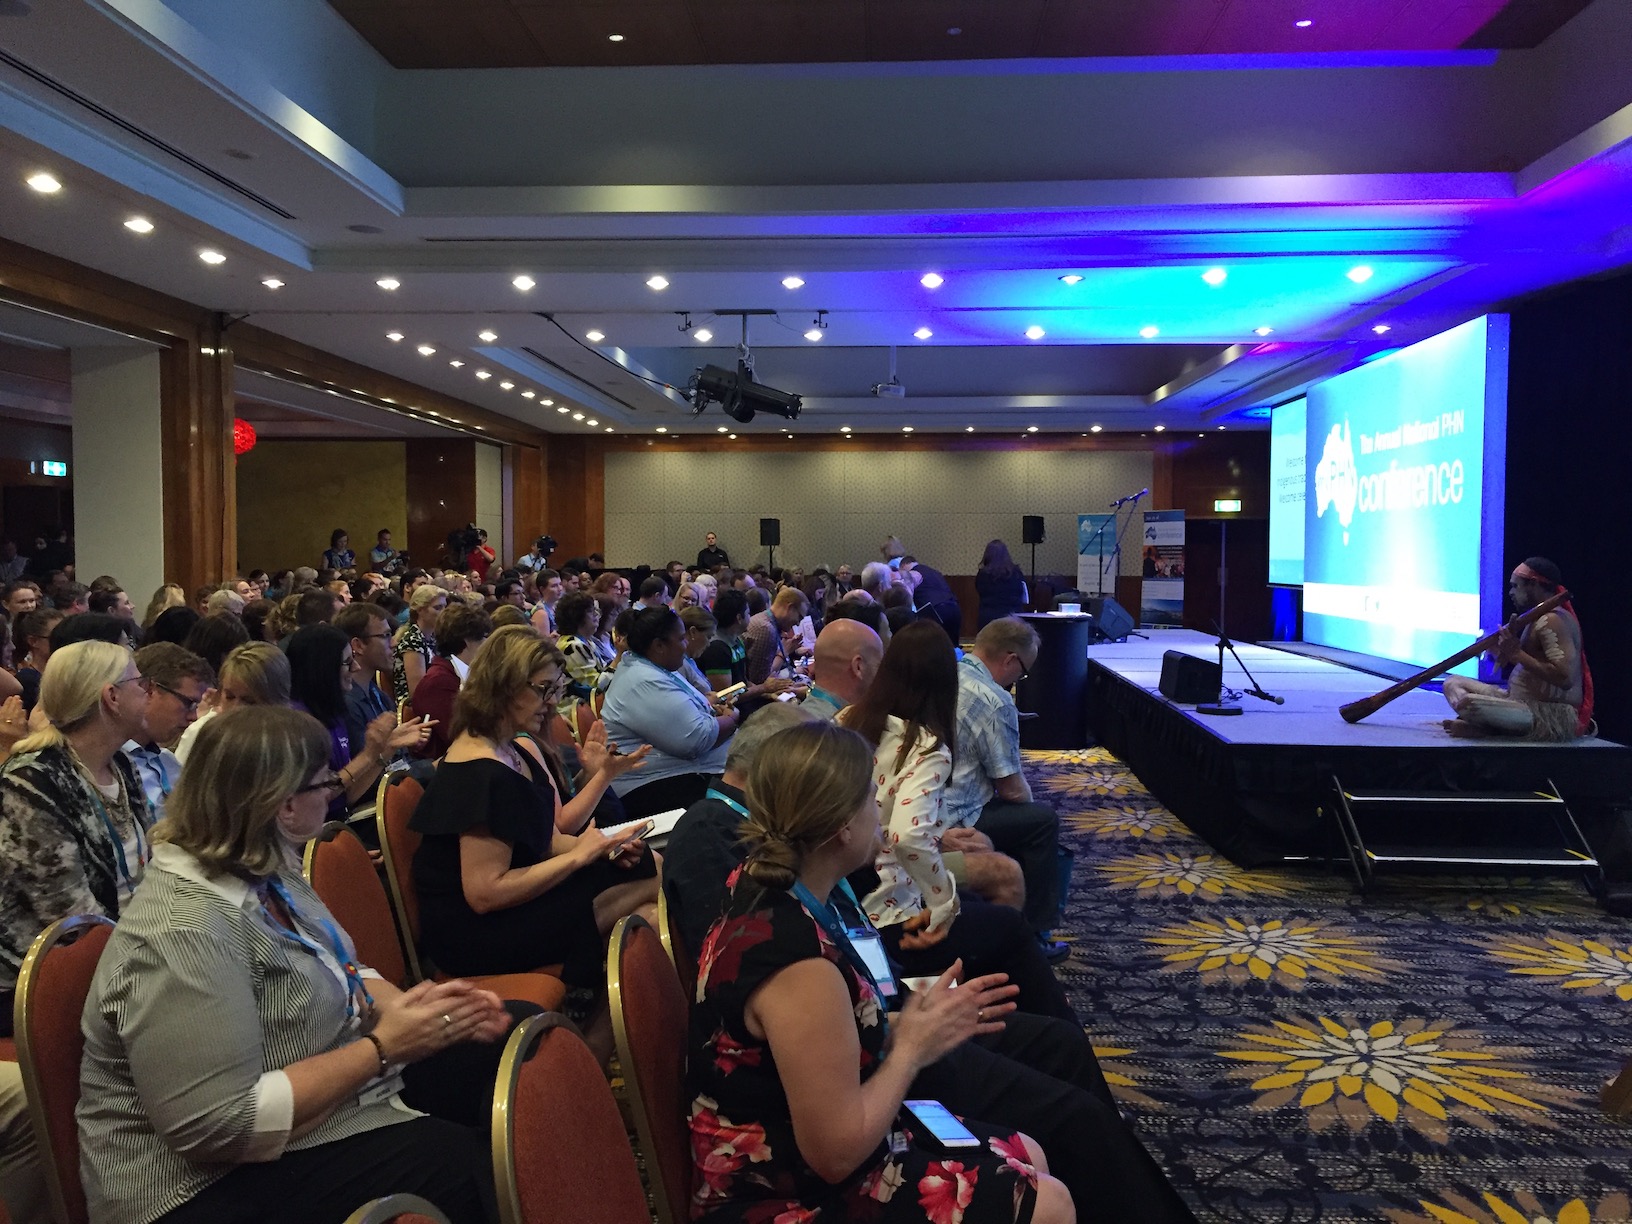
Welcome to Country Ceremony
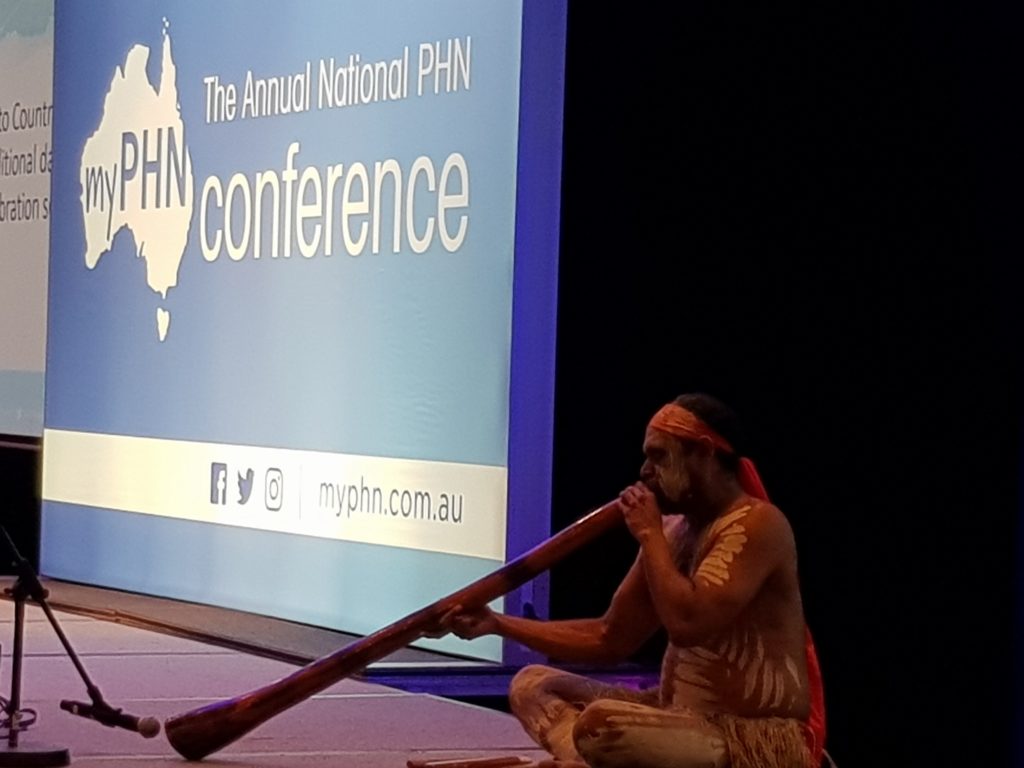
Welcome to Country Ceremony
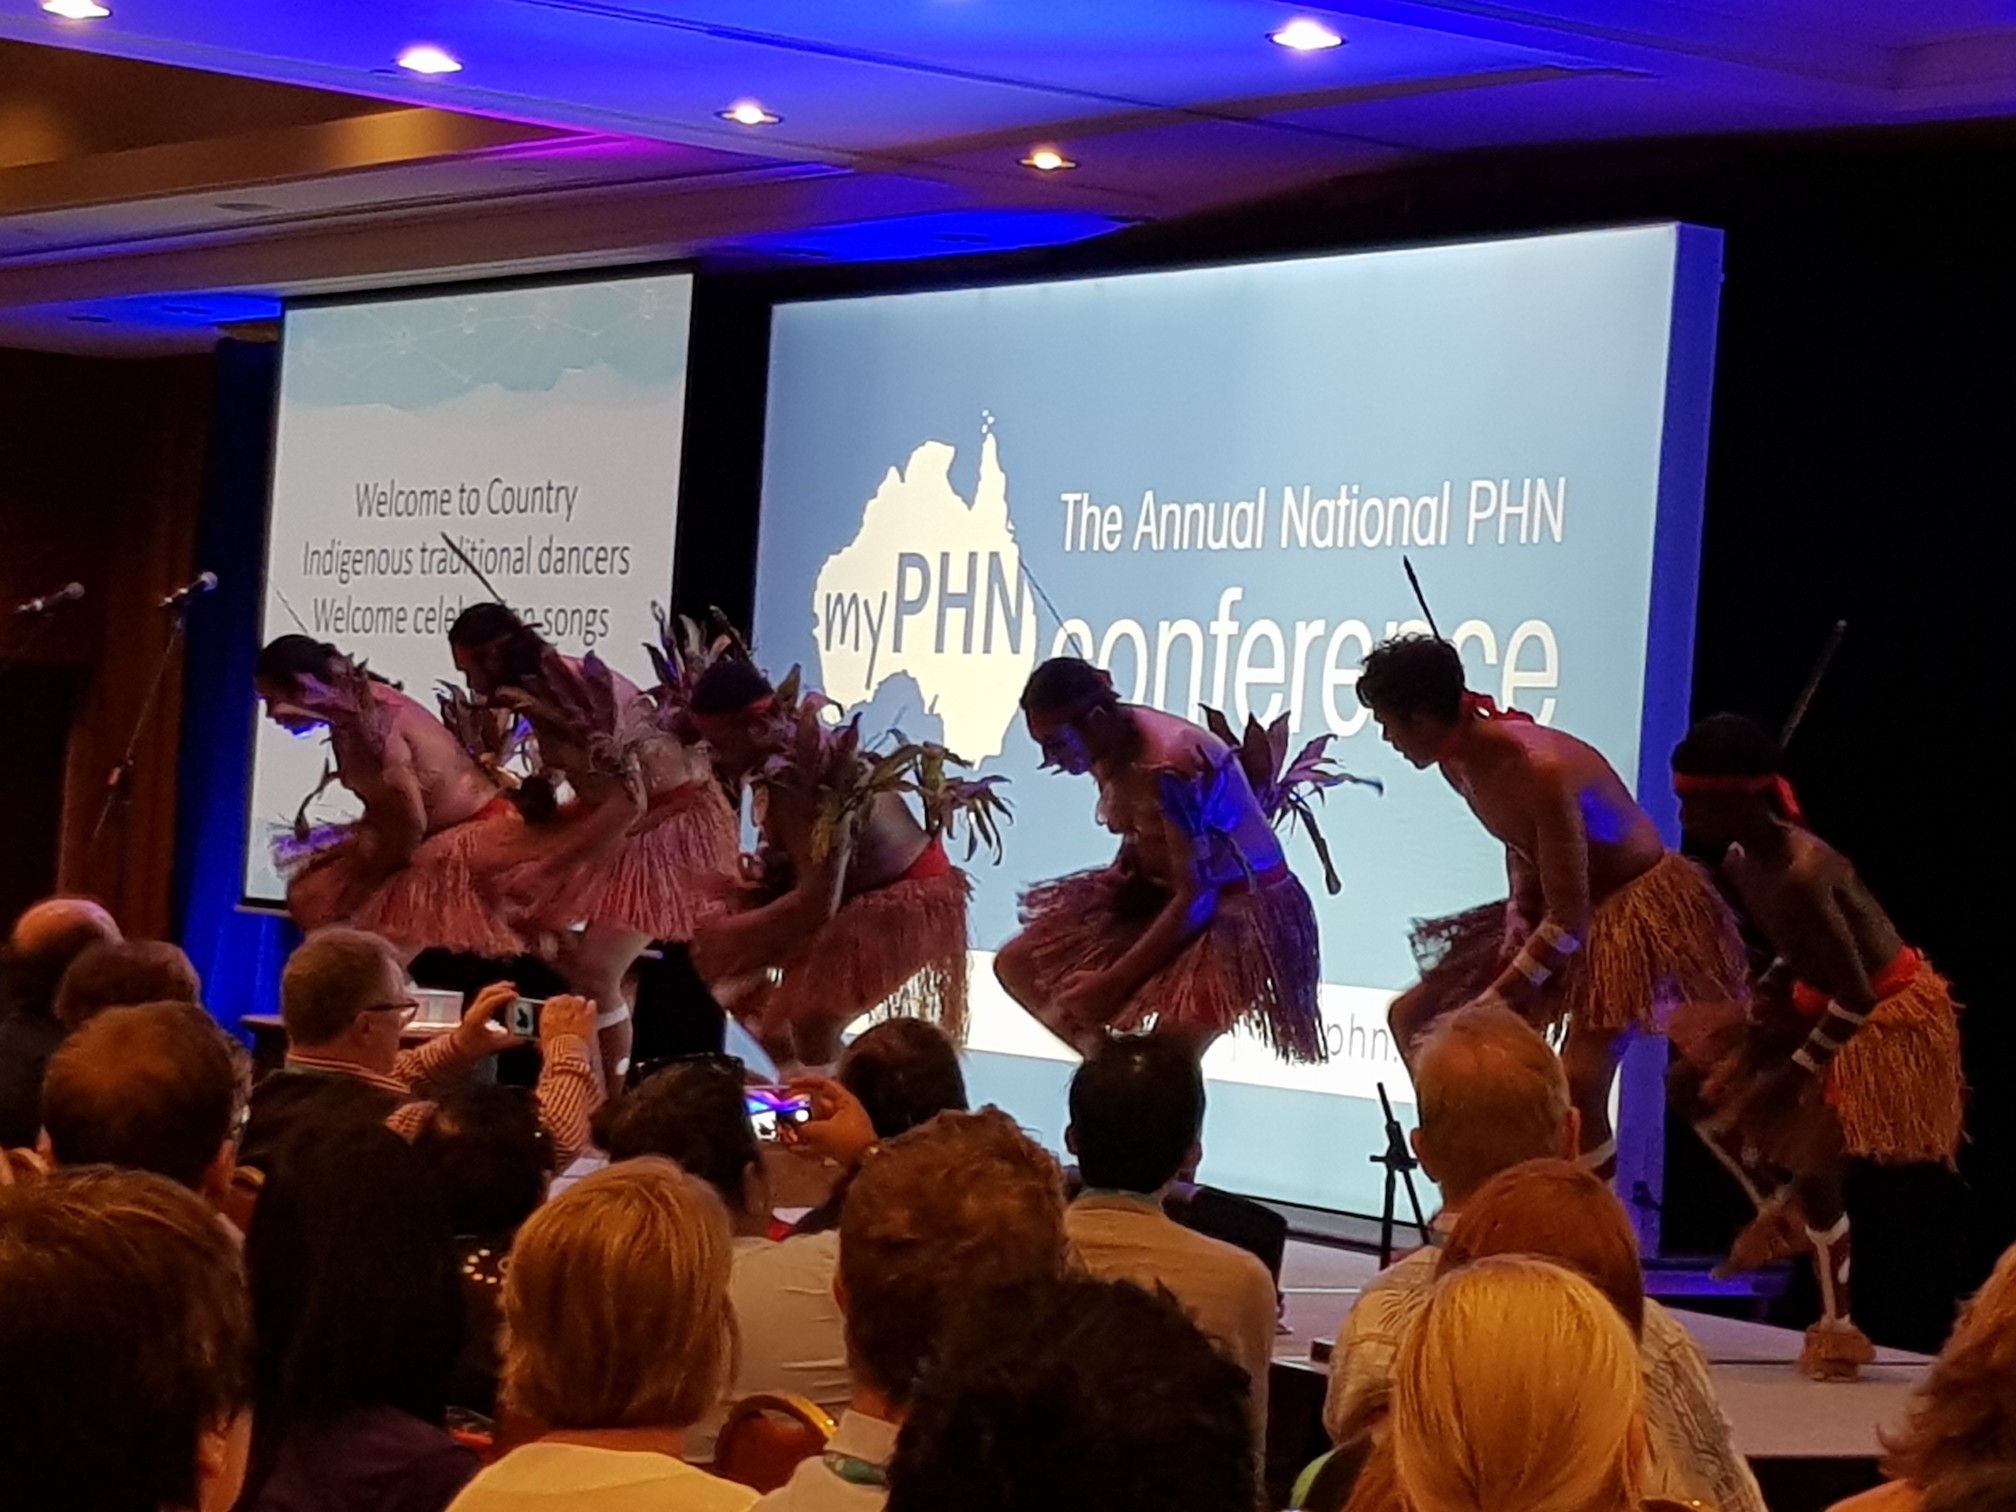
Traditional Indigenous Dance – Gerib Sik
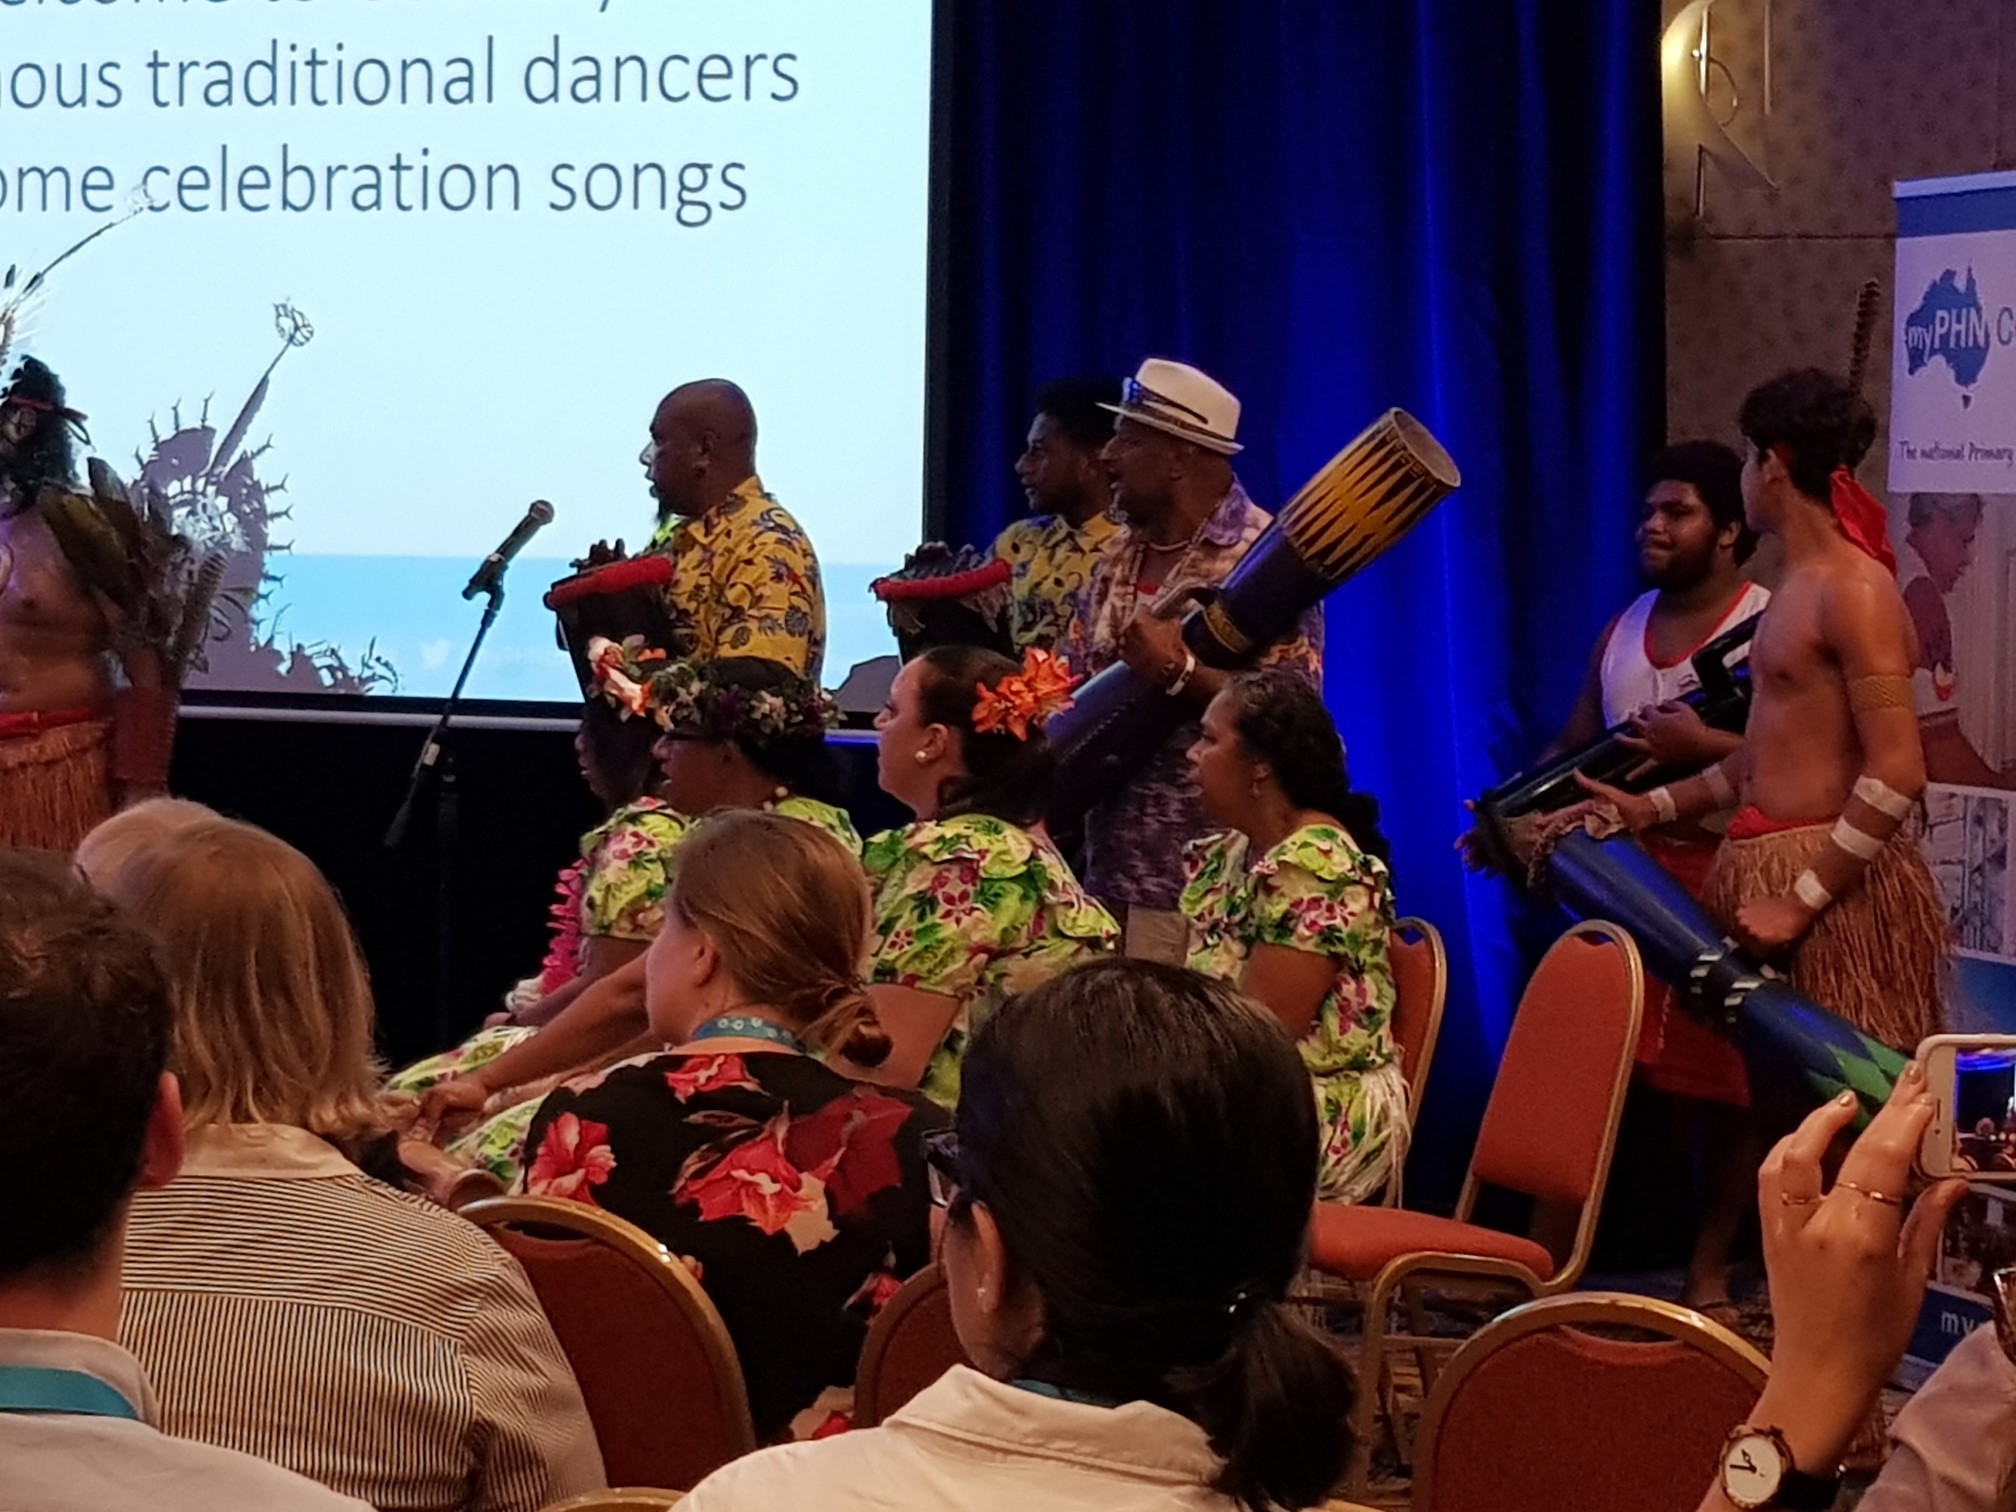
Traditional Indigenous Dance – Gerib Sik